We see the prevalence of the notion “customization is king” every time we shop.
The latest mobile device comes in different models, sizes, colors, and storage options—paired with unique packaging for each carrier. Soft drinks come in hundreds of flavors, sizes, and packaging formats. Portfolio proliferation is common across organizations we serve. In one instance, a dairy manufacturer operated with more than 1,300 SKUs, while an industrial cleaning products company managed close to 2,000 products. Large industrial manufacturers often have tens of thousands of products.
While variety aims to satisfy customers, it can drive complexity and introduce costs that are often ignored or incorrectly allocated.
Not all products are created equal. They differ in volume, margin, and operational demands. As portfolios expand, so do the planning, scheduling, inventory, and SG&A burdens required to sustain them—costs that traditional accounting rarely traces back to the products that generate them.
The effect is profound. Our research shows that a third or fewer products often generate up to 300% of profits, while the rest destroy 200%. Yet most companies manage their portfolios as if profitability were evenly distributed, reinforcing complexity instead of confronting it.
Square-root costing reveals true customer and product profitability
We developed square-root costing, a rapid, top-down approach that incorporates financial and operational data as an alternative to traditional, time-intensive costing methods, such as activity-based costing. Square-root costing gives companies a practical way to understand their true profitability, uncover insights, and identify key interventions.
Companies typically treat costs as either fixed or variable. However, a significant and growing portion of costs falls into a third category: complexity costs. These costs are driven by variety, such as SG&A, working capital, and manufacturing overhead. Square-root costing enables a more accurate allocation of these otherwise hidden costs.
Armed with this knowledge, companies can understand true customer and product profitability and build better strategies related to product mix, innovation, and geographic footprint, enabling them to better compete in a complex world.
Representing profit on a whale curve
To understand true profit concentration, we use square-root costing to plot cumulative profit margin adjusted for complexity costs against cumulative revenue. Figure 1 illustrates the impact of complexity costs on firm profitability. As complexity grows with the addition of more products, costs grow geometrically to a high point. Maximum profitability occurs at the inflection point.
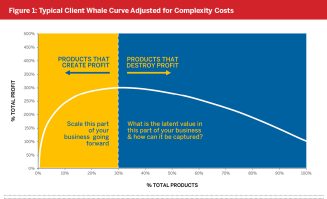
The stark representation of profit concentration provided by a whale curve is eye-opening, with three key insights:
- While the profit-destroying products warrant attention, identifying the level of profit concentration underscores the need to appropriately resource and support the 20% to 30% of profitable products. Often, profitable products are undersupported, as they are treated the same as the rest of the underperforming portfolio.
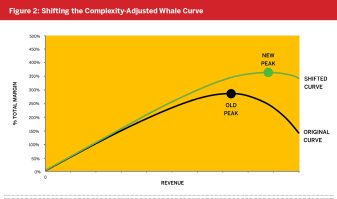
- The shape of a company’s whale curve is dynamic and can be reshaped to unlock higher profitability, as shown in Figure 2. Companies often try to improve performance by using SKU rationalization in a binary way, keeping the products that look profitable and removing those that fall below a hurdle rate. While SKU rationalization can be a key lever, it leaves considerable opportunity unrealized. Identifying and reducing complexity costs can lift overall profitability, reflected visually by a whale curve that shifts up and to the right, with minimal impact on revenue.
- The opportunity isn’t only at the extremes. A large middle of near break-even products often traps capital and talent. Even within profitable segments, overlapping or substitutable offerings can fragment demand and dilute incremental returns. By consolidating similar products, companies can free resources and redeploy them to higher-growth areas.
Case study: a manufacturer regains profitability
An agricultural product manufacturer was struggling with close to 1,000 SKUs spread across many manufacturing facilities. By using square root costing to accurately allocate costs and analyzing its whale curve, it was revealed that at one facility, only 21% of its products were profitable, generating 380% of profits. The remaining 79% of products—representing only 19% of volume—destroyed 280% of profits.
The manufacturer captured a 25% profit improvement by selectively removing unprofitable SKUs and rebalancing its plant loading to eliminate significant transportation and storage costs, shifting its whale curve up and to the right.
________
Most leadership teams recognize the symptoms of complexity but lack a clear view of its cost. Others see profit concentrated in a handful of products or customers yet continue spreading resources broadly across the portfolio. Without a fact base that reveals true profitability, growth strategies risk reinforcing the very imbalances that constrain performance. Complexity-adjusted whale curves provide that clarity, helping leaders build growth strategies grounded in where value is truly created—and where it can be unlocked.
About the Authors
Stephen Wilson is a Managing Director at Innosight, based in Dallas. stwilson@innosight.com
Andrei Perumal is a Managing Director at Innosight, based in Dallas. aperumal@innosight.com